
ACQUISITION DASHBOARD
Understand your acquisition without having to build the report.
Vestige brings together data from your pages and campaigns so you can track investment, visits, leads, conversions, and sources in an analysis-ready view.
Easy-to-install pixel. Fast integrations. Data organized automatically.
LESS MANUAL WORK
If the data already exists, why is it so hard to understand what happened?
Ad platform investment. Page visits. Form leads. Sources in UTMs. In the end, you still have to bring everything together to understand how your acquisition actually performed.
Vestige connects this information and turns scattered data into a ready-to-track view.
SIMPLE FROM THE FIRST DATA POINT
Set up data collection. Vestige takes care of the rest.
You connect the dots once. From then on, Vestige collects, combines, and organizes the information needed to track acquisition.
Install Vestige Pixel
Add the pixel to your pages to start tracking visits, visitors, leads, and their sources.
Connect your platforms
Connect your media accounts to enrich the analysis with investment, campaign, ad, and performance data.
Track everything in Vestige
Data arrives organized in the Acquisition Dashboard, ready for you to analyze your operation.
EVERYTHING IN ONE VIEW
From investment to lead, track what is really happening.
View your main acquisition metrics, track their progress over time, and investigate the data without manually consolidating reports.
UTM + LTM
Do not just count leads. Understand where they came from.
Vestige organizes your acquisition sources to show which channels, campaigns, and ads are behind your results.
The UTMs you already know, plus the context you were missing.
In addition to traditional UTMs, Vestige uses LTMs to enrich tracking with data from your media campaigns.
See how LTM works →PERFORMANCE BY PAGE
Discover which pages are doing the work.
Compare visits, visitors, leads, sign-ups, and conversion across your pages and quickly identify where acquisition performs best.
From traffic to conversion, every page becomes part of the same analysis.
YOUR DATA, YOUR WAY
One acquisition operation. Different ways to view the results.
Organize the same data into views that answer your operation’s questions—without rebuilding the report every time.
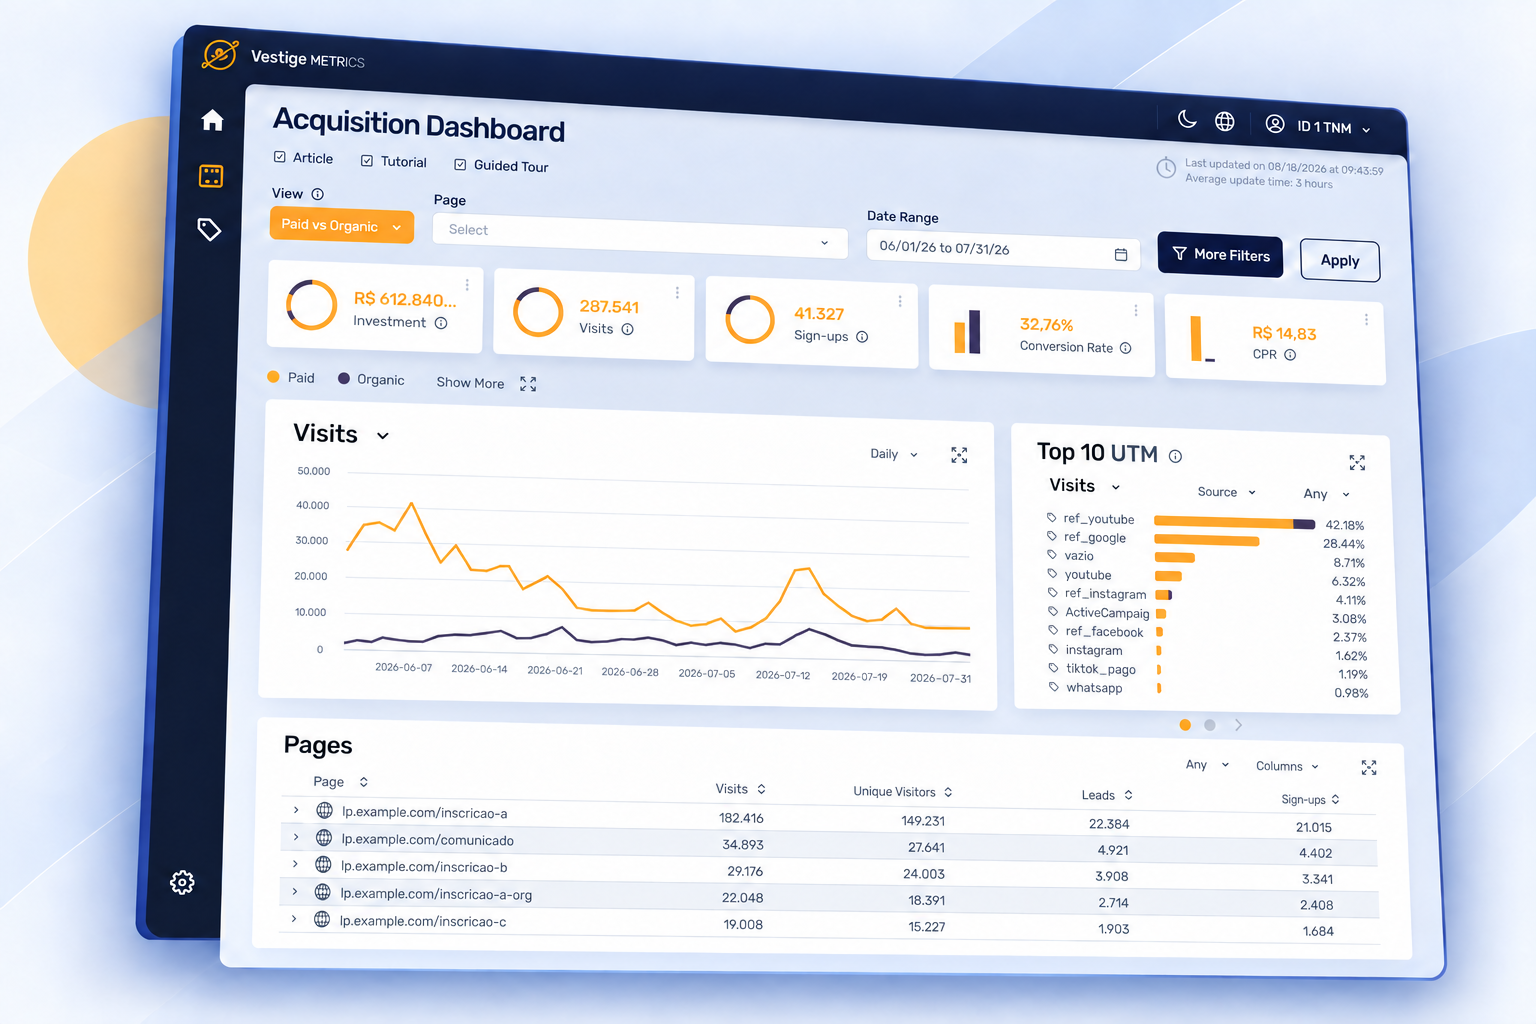
Paid vs. Organic
Quickly compare how much acquisition came from paid media versus organic sources.
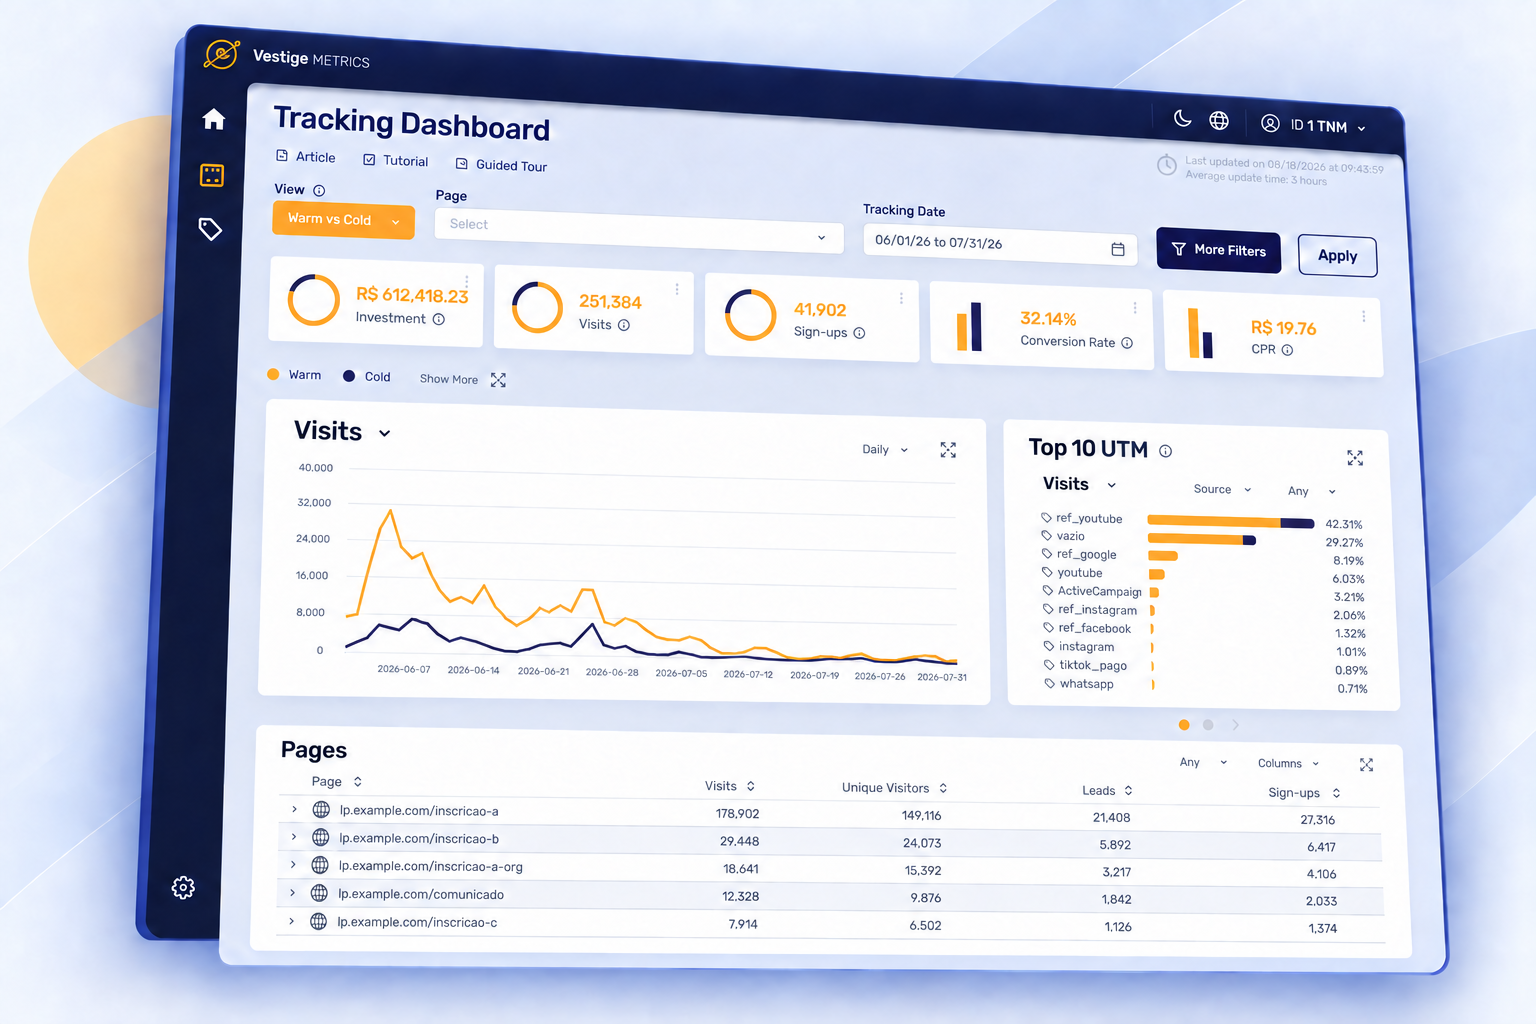
Warm vs. Cold
Use your operation’s rules to segment audiences and track each group’s performance.
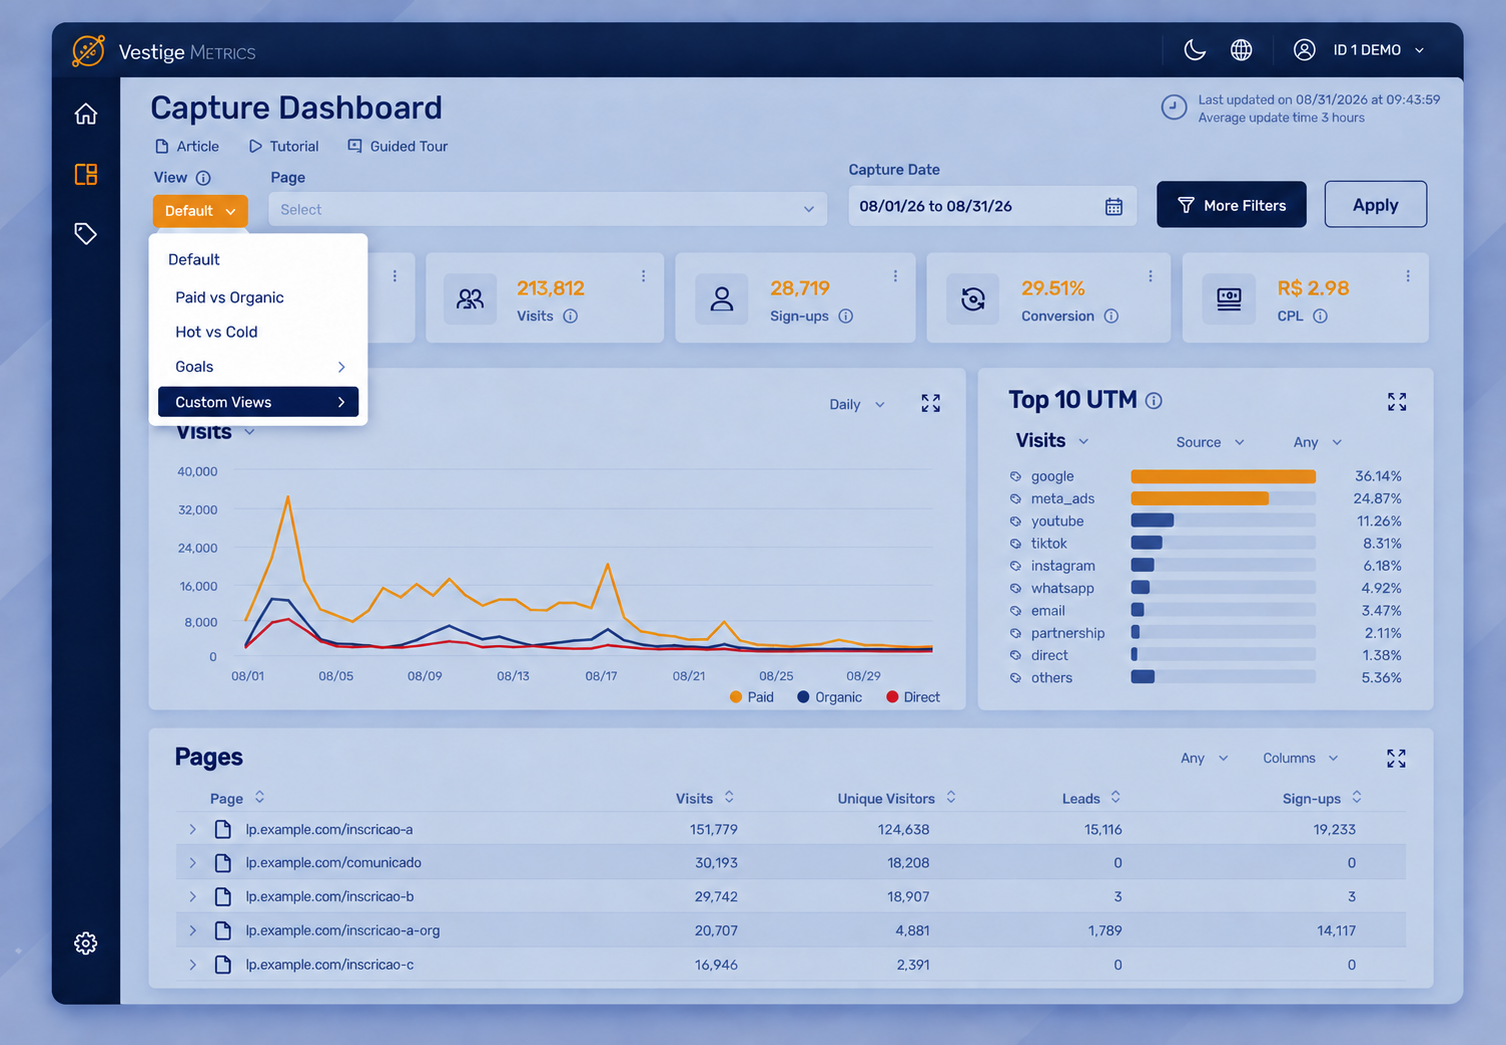
Custom views
Create groups based on the structure and naming your team already uses.
CUSTOM VIEWS
Your naming becomes a report.
If your campaigns follow a naming convention, Vestige can interpret that structure and turn each part into an analysis dimension.
Configure the structure once and reuse the pattern to organize data automatically.
PLANNED × ACTUAL
Do not only track what happened. Know whether it is happening as it should.
Set goals for your main acquisition metrics and compare actual results with the plan over time.
Quickly see whether your operation is on pace and identify deviations before the period ends.
FROM INFORMATION TO DECISION
Less time preparing data. More time understanding what to do with it.
Find what is working
Compare sources, campaigns, and pages to identify where acquisition delivers the best results.
Act while it still matters
Track progress during the period without waiting for the next report to be consolidated.
Standardize your analysis
Turn your rules and naming conventions into reusable views.
Compare plan and execution
Use goals to track whether results are following the planned pace.
FROM ACQUISITION TO REVENUE
The lead arrived. Now find out whether they bought.
The Acquisition Dashboard shows how your leads arrived. In the Sales Dashboard, you track what happened next and connect acquisition to results.
Explore the Sales Dashboard →Your acquisition ready to analyze, not assemble.
Connect your operation to Vestige Metrics and track the data that truly matters in a view designed to support decisions.
Get startedSet up your operation and start tracking your data.